Vertical Citizens
Unfinished d3.js studies that trace a day of elevator trips up and down De Rotterdam, Rem Koolhaas' vertical city, for a web documentary about its new inhabitants.
De Rotterdam, Rem Koolhaas’ skyscraper, was billed as the first vertical city in the Netherlands: one building where people live, work and relax around the clock. In a city stacked more than forty floors high, the streets run through elevator shafts. My material was the elevator data, one row per trip: the cab, its start and end floor, its start and end time, and how full it was. A single Tuesday, 18 November 2014, holds more than 16,000 trips by 21 cabs across the East, Mid and West towers.
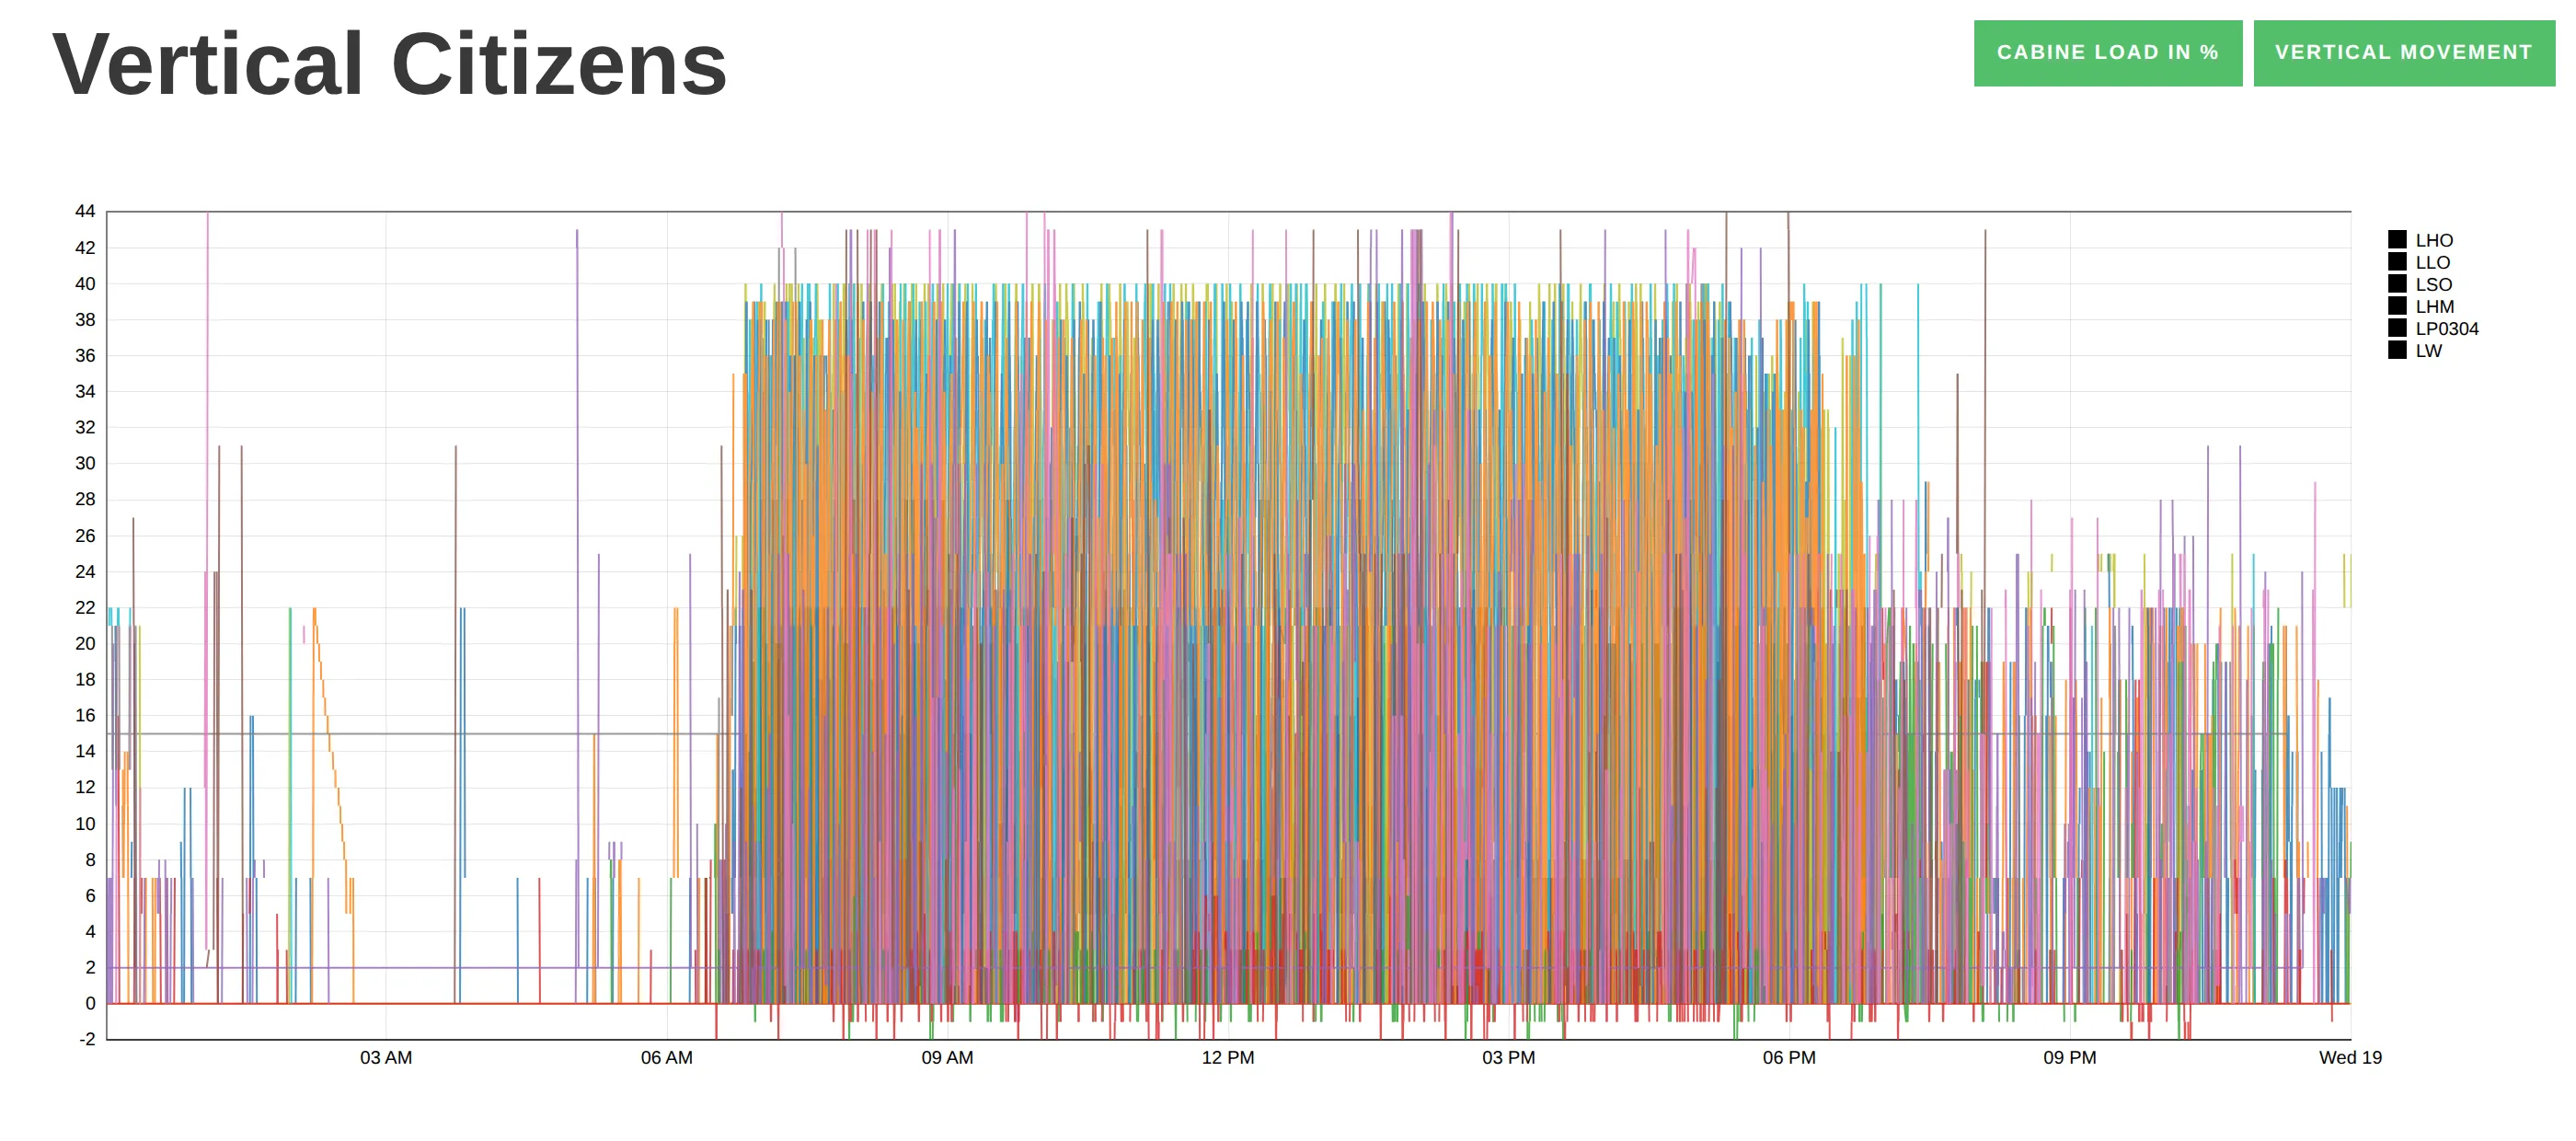
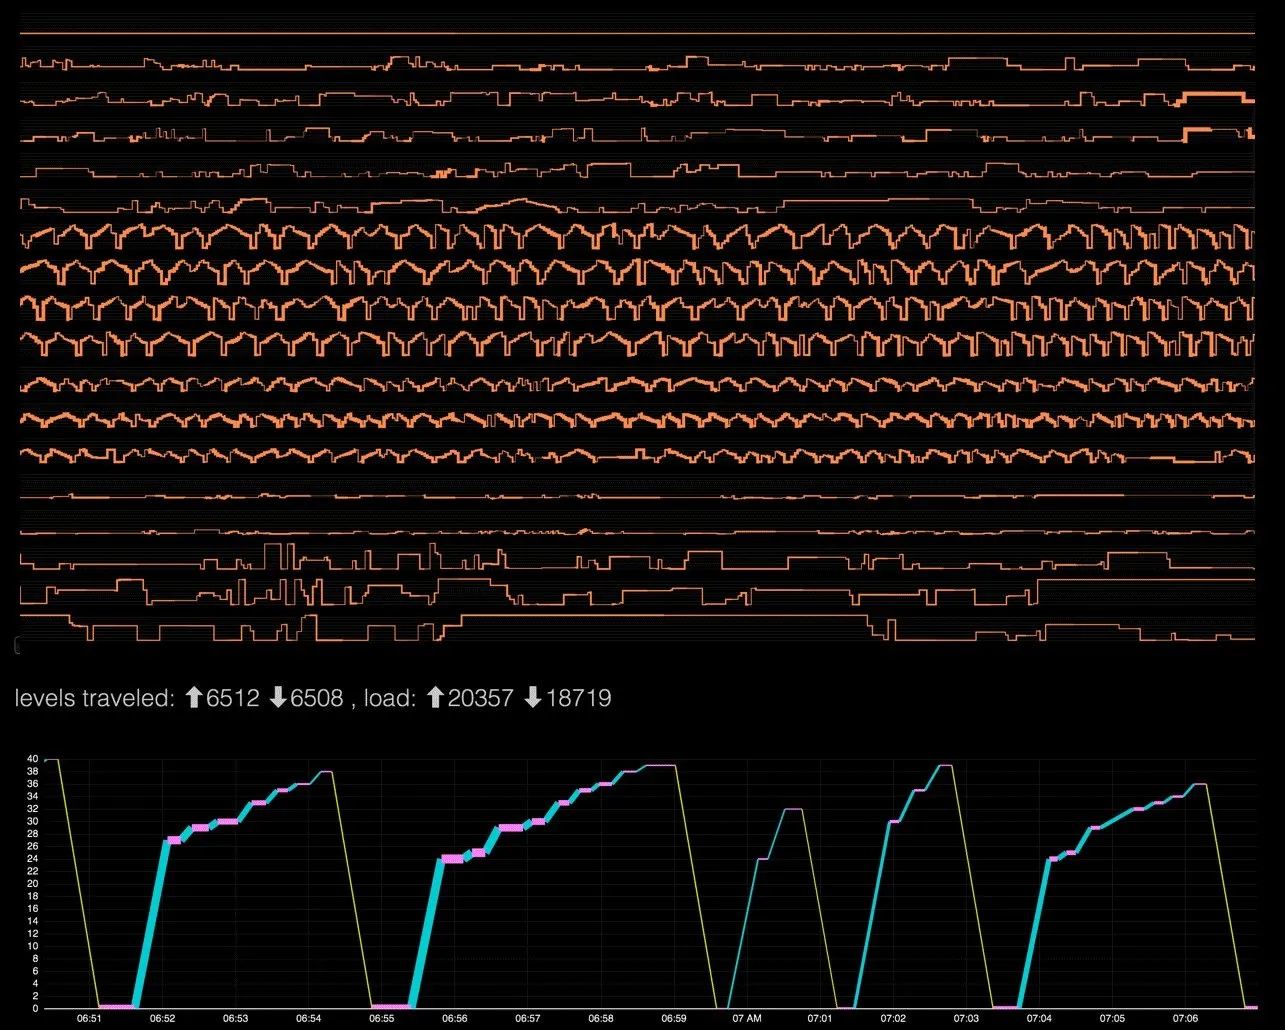
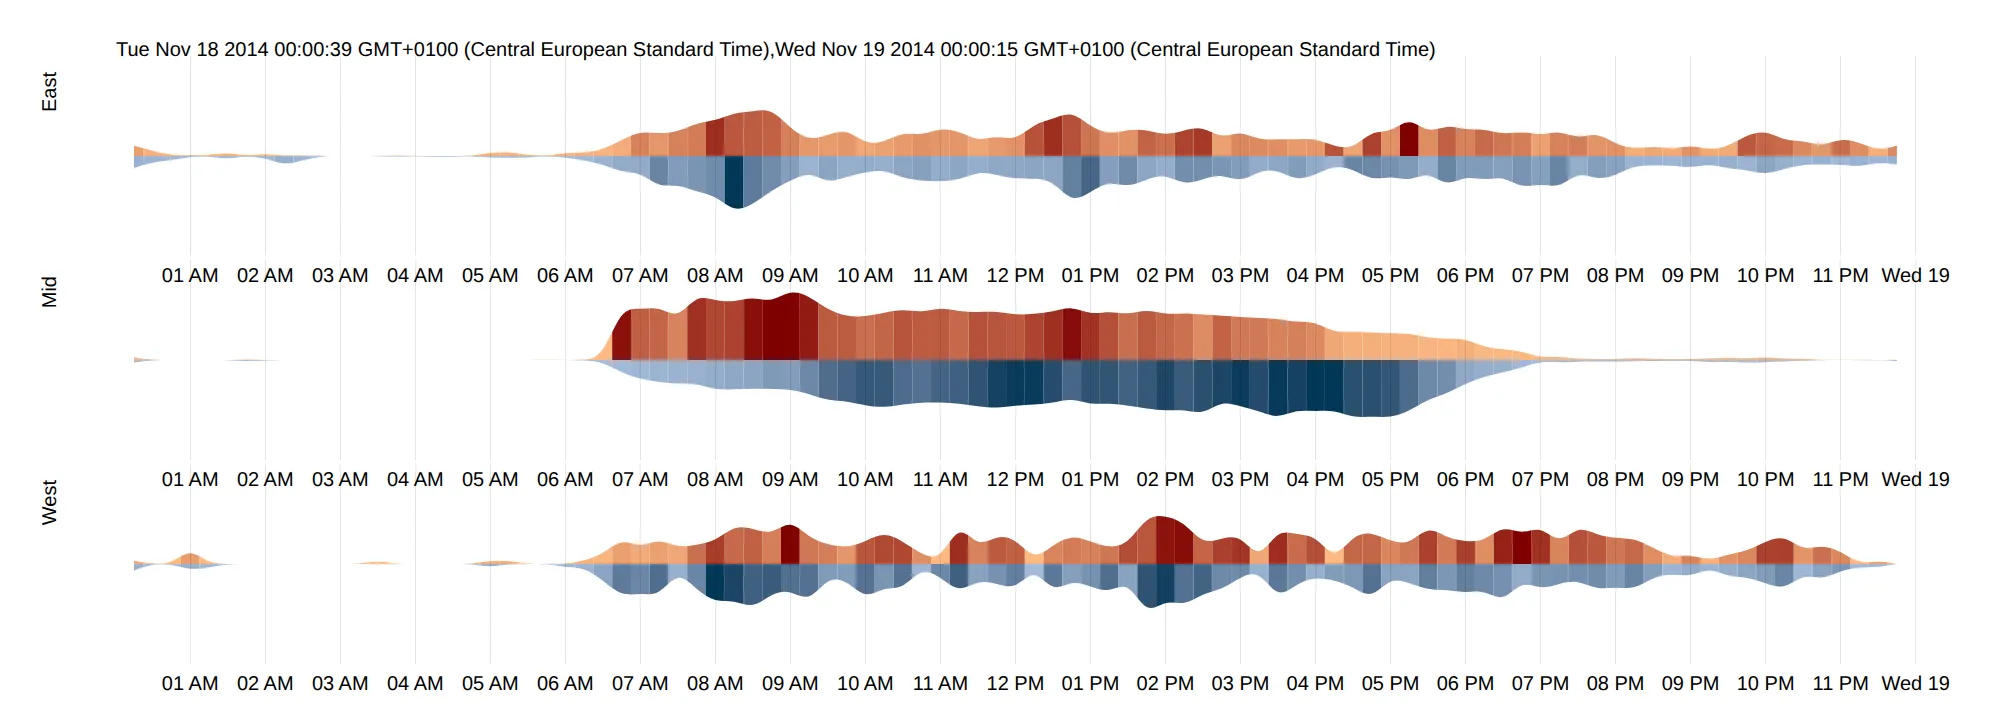
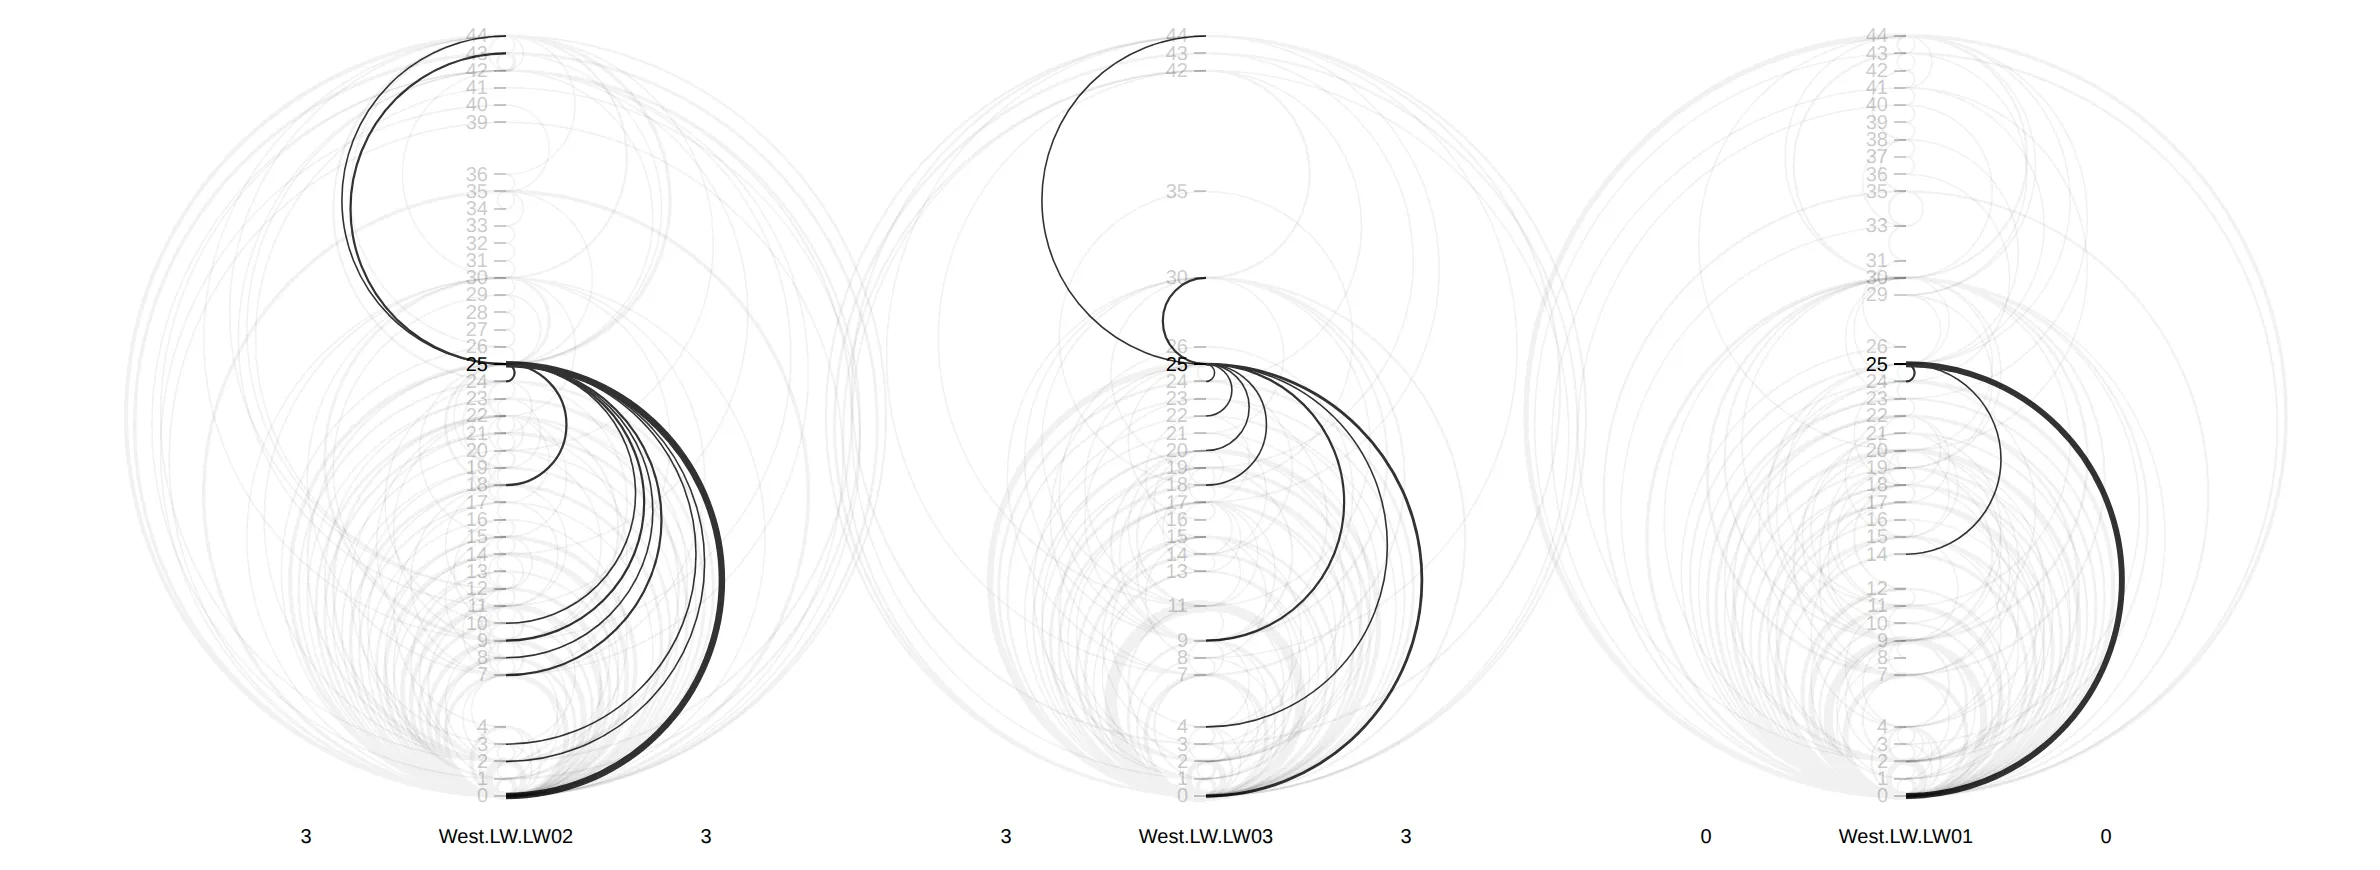
I wrote twenty small d3.js studies, each trying another way into the traffic. One draws every trip of the day as a line from floor to floor and switches, at a click, to how loaded the cabs were. Another slices each tower’s day into quarter hours, upward trips above the axis and downward ones below, darker where they carried more load: in the Mid tower, the climb peaks between eight and ten in the morning and the descent between three and five in the afternoon. For the West tower’s three cabs on a Thursday in April, each pair of start and end floors becomes an arc, drawn thicker the more trips made it, upward trips curving left and downward ones right; hovering over a floor picks out the trips that leave from it.
The liveliest sketch puts the title itself in the elevators: the letters of “VERTICALCITIZEN” each ride one cab, replaying that November day in step with the viewer’s clock over a looping video, which has since disappeared from Vimeo. Paul Swagerman’s design for the documentary’s first episode scatters the letters of the title up and down the facade, too.
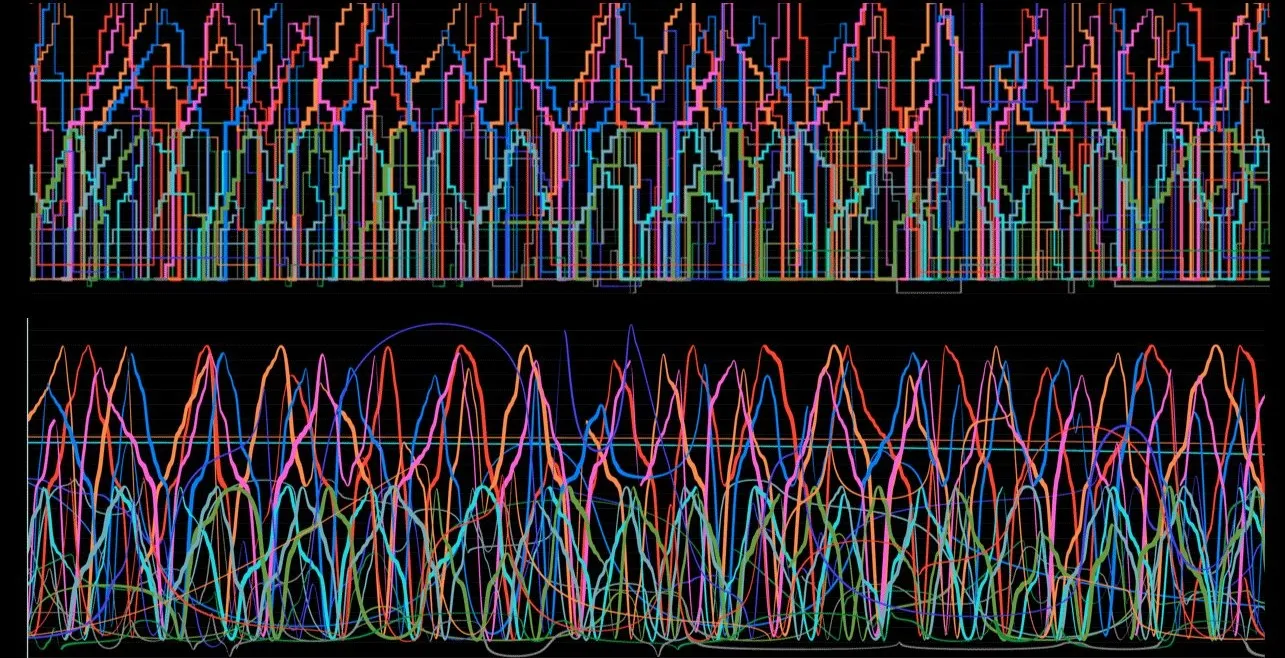
Vertical Citizens was Paul’s web documentary, funded by the Creative Industries Fund. Alongside a television documentary following five main characters, the website was to portray the building as a whole, in 24 “snapshots” of 24 hours of monitoring, and Paul’s project page credits me with the data visualization. My studies never got past work in progress. In 2021 I put them on GitHub as they were, with a composite of eight charts on black as the README image, and all twenty still run on GitHub Pages. Trips with a start, an end and a time were also the raw material of cf. city flows that same year.