GEI-Digital Visualized
Four linked views that chart the historical German schoolbooks in the Georg Eckert Institute's digital library by year, publishing place, publisher, subject and school level.
GEI-Digital is the Georg Eckert Institute’s online library of historical schoolbooks. At the time of this project it brought together German textbooks from the 17th century to 1918, from history and geography books to readers. As the collection kept growing, the pressing questions were what it actually contained and how that was spread across time, place and subject. »GEI-Digital visualisiert« answers them with four linked views on a single page, as a research tool and a presentation tool at once.
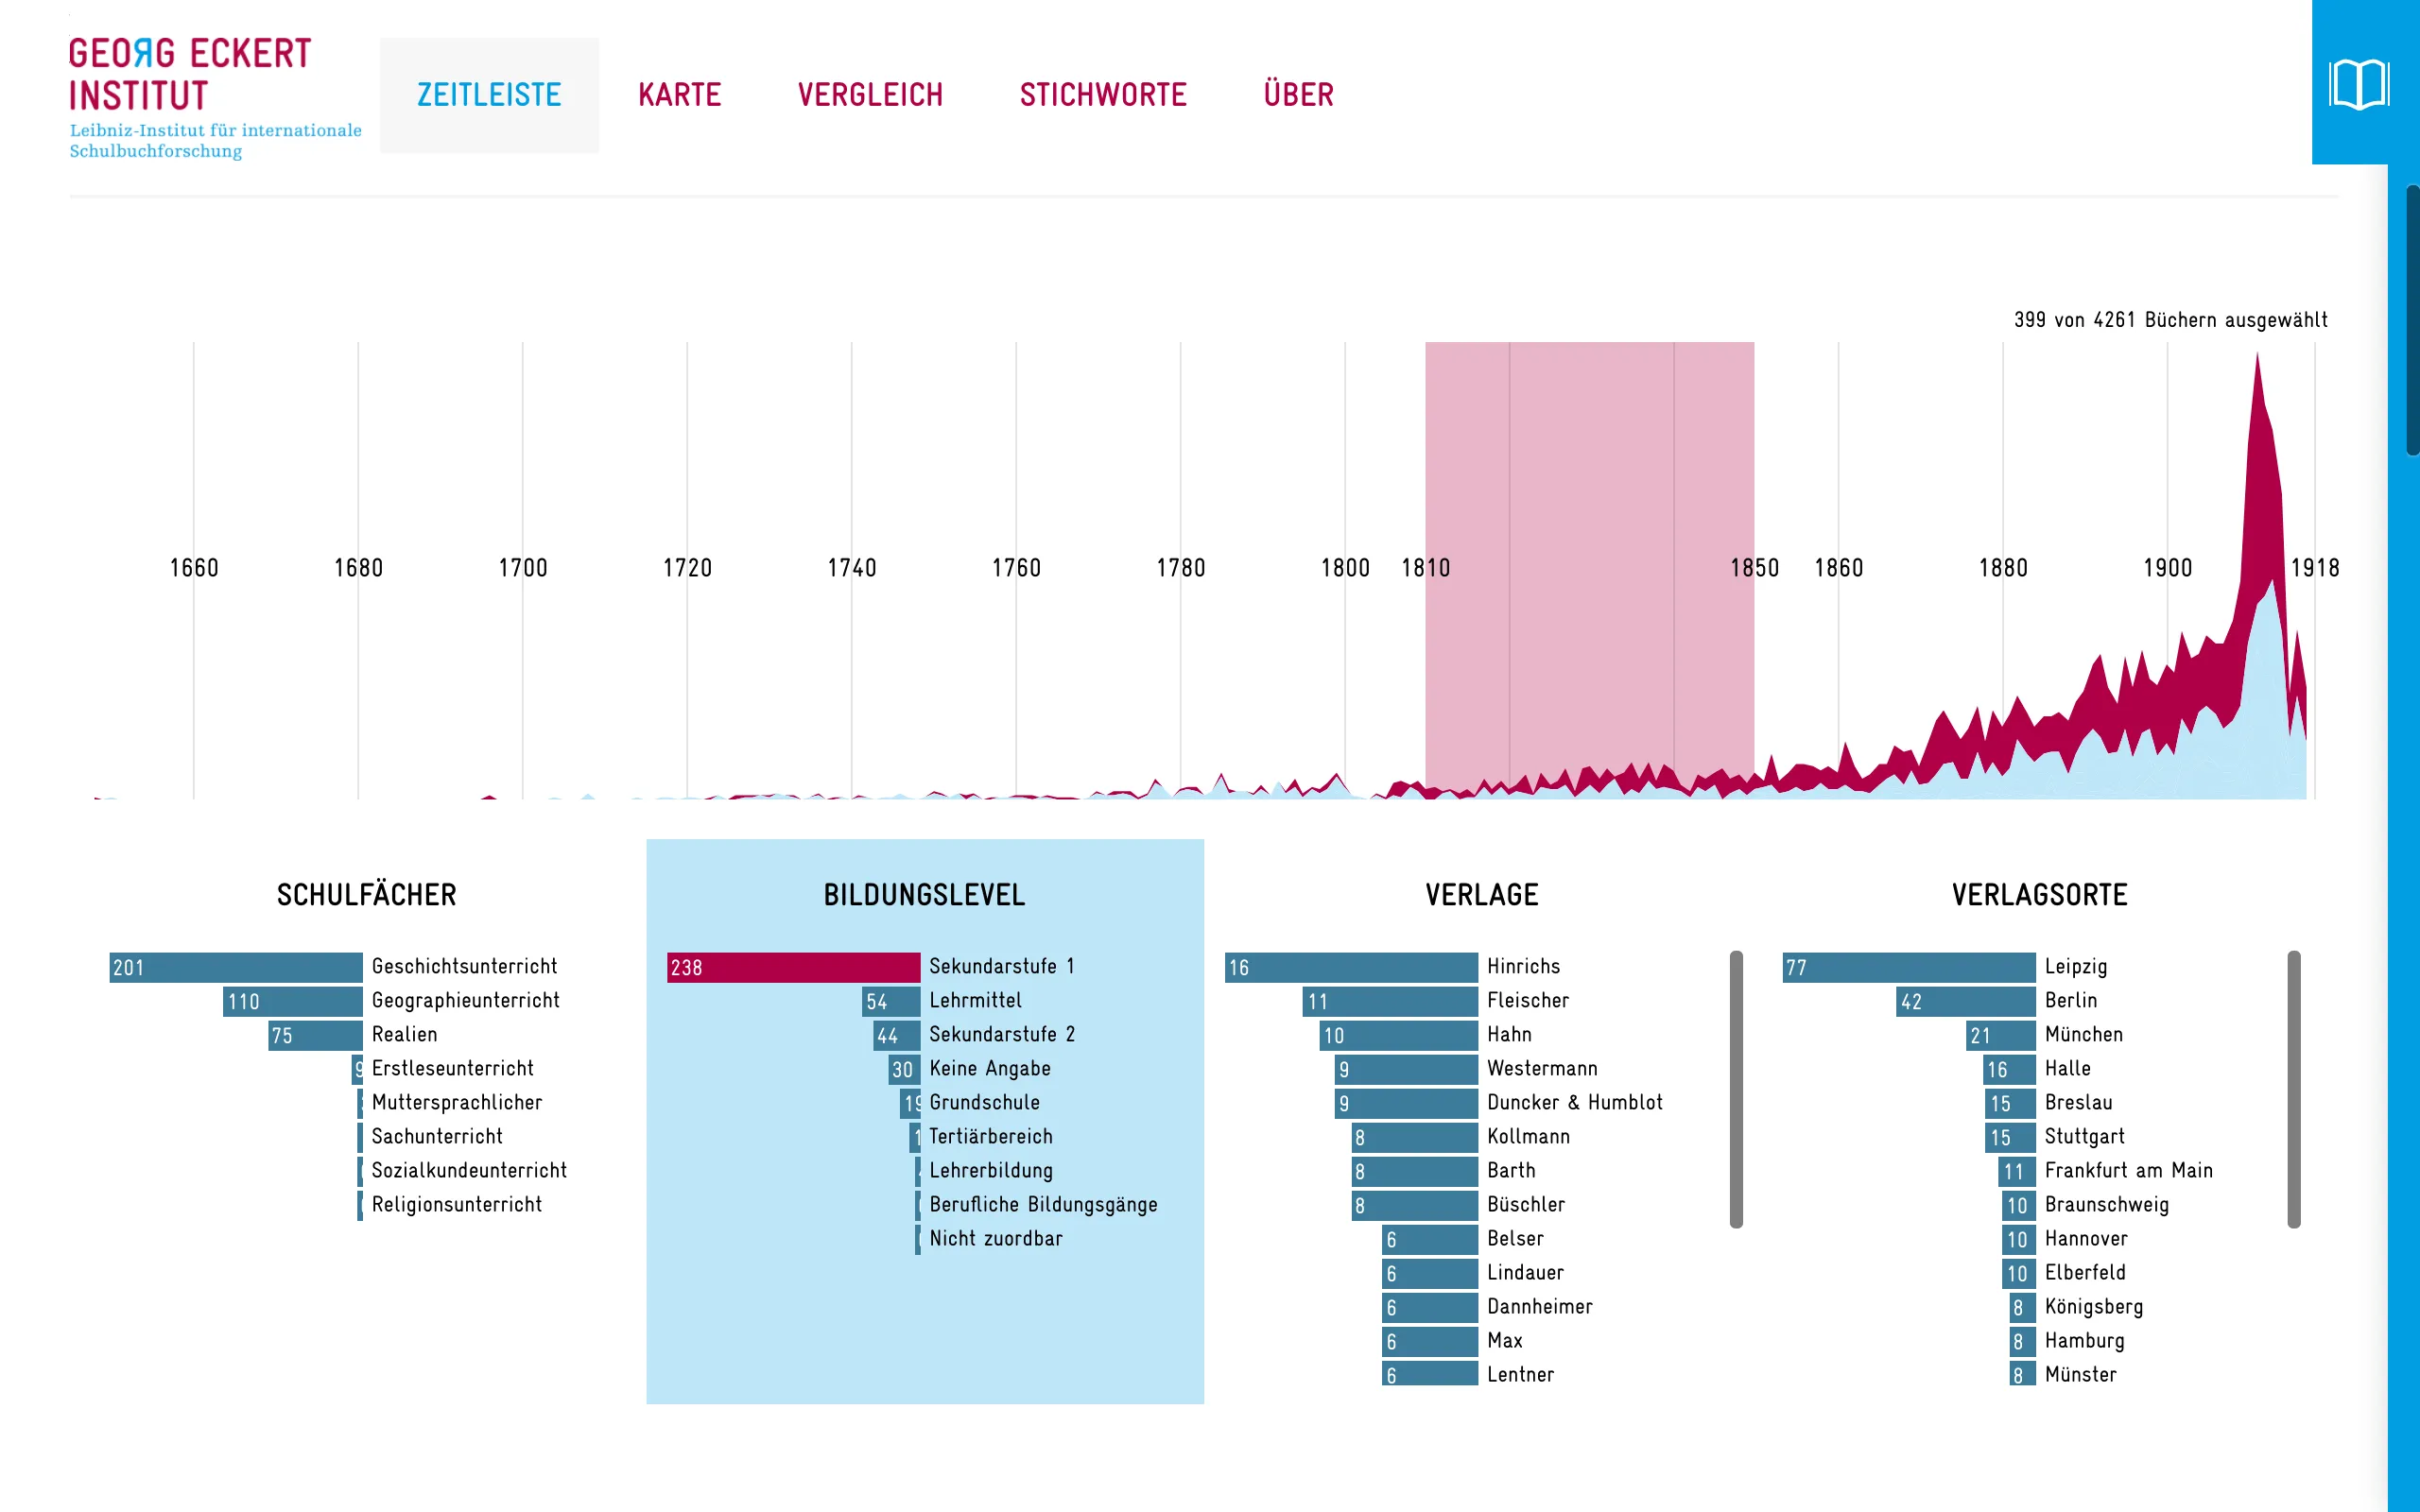
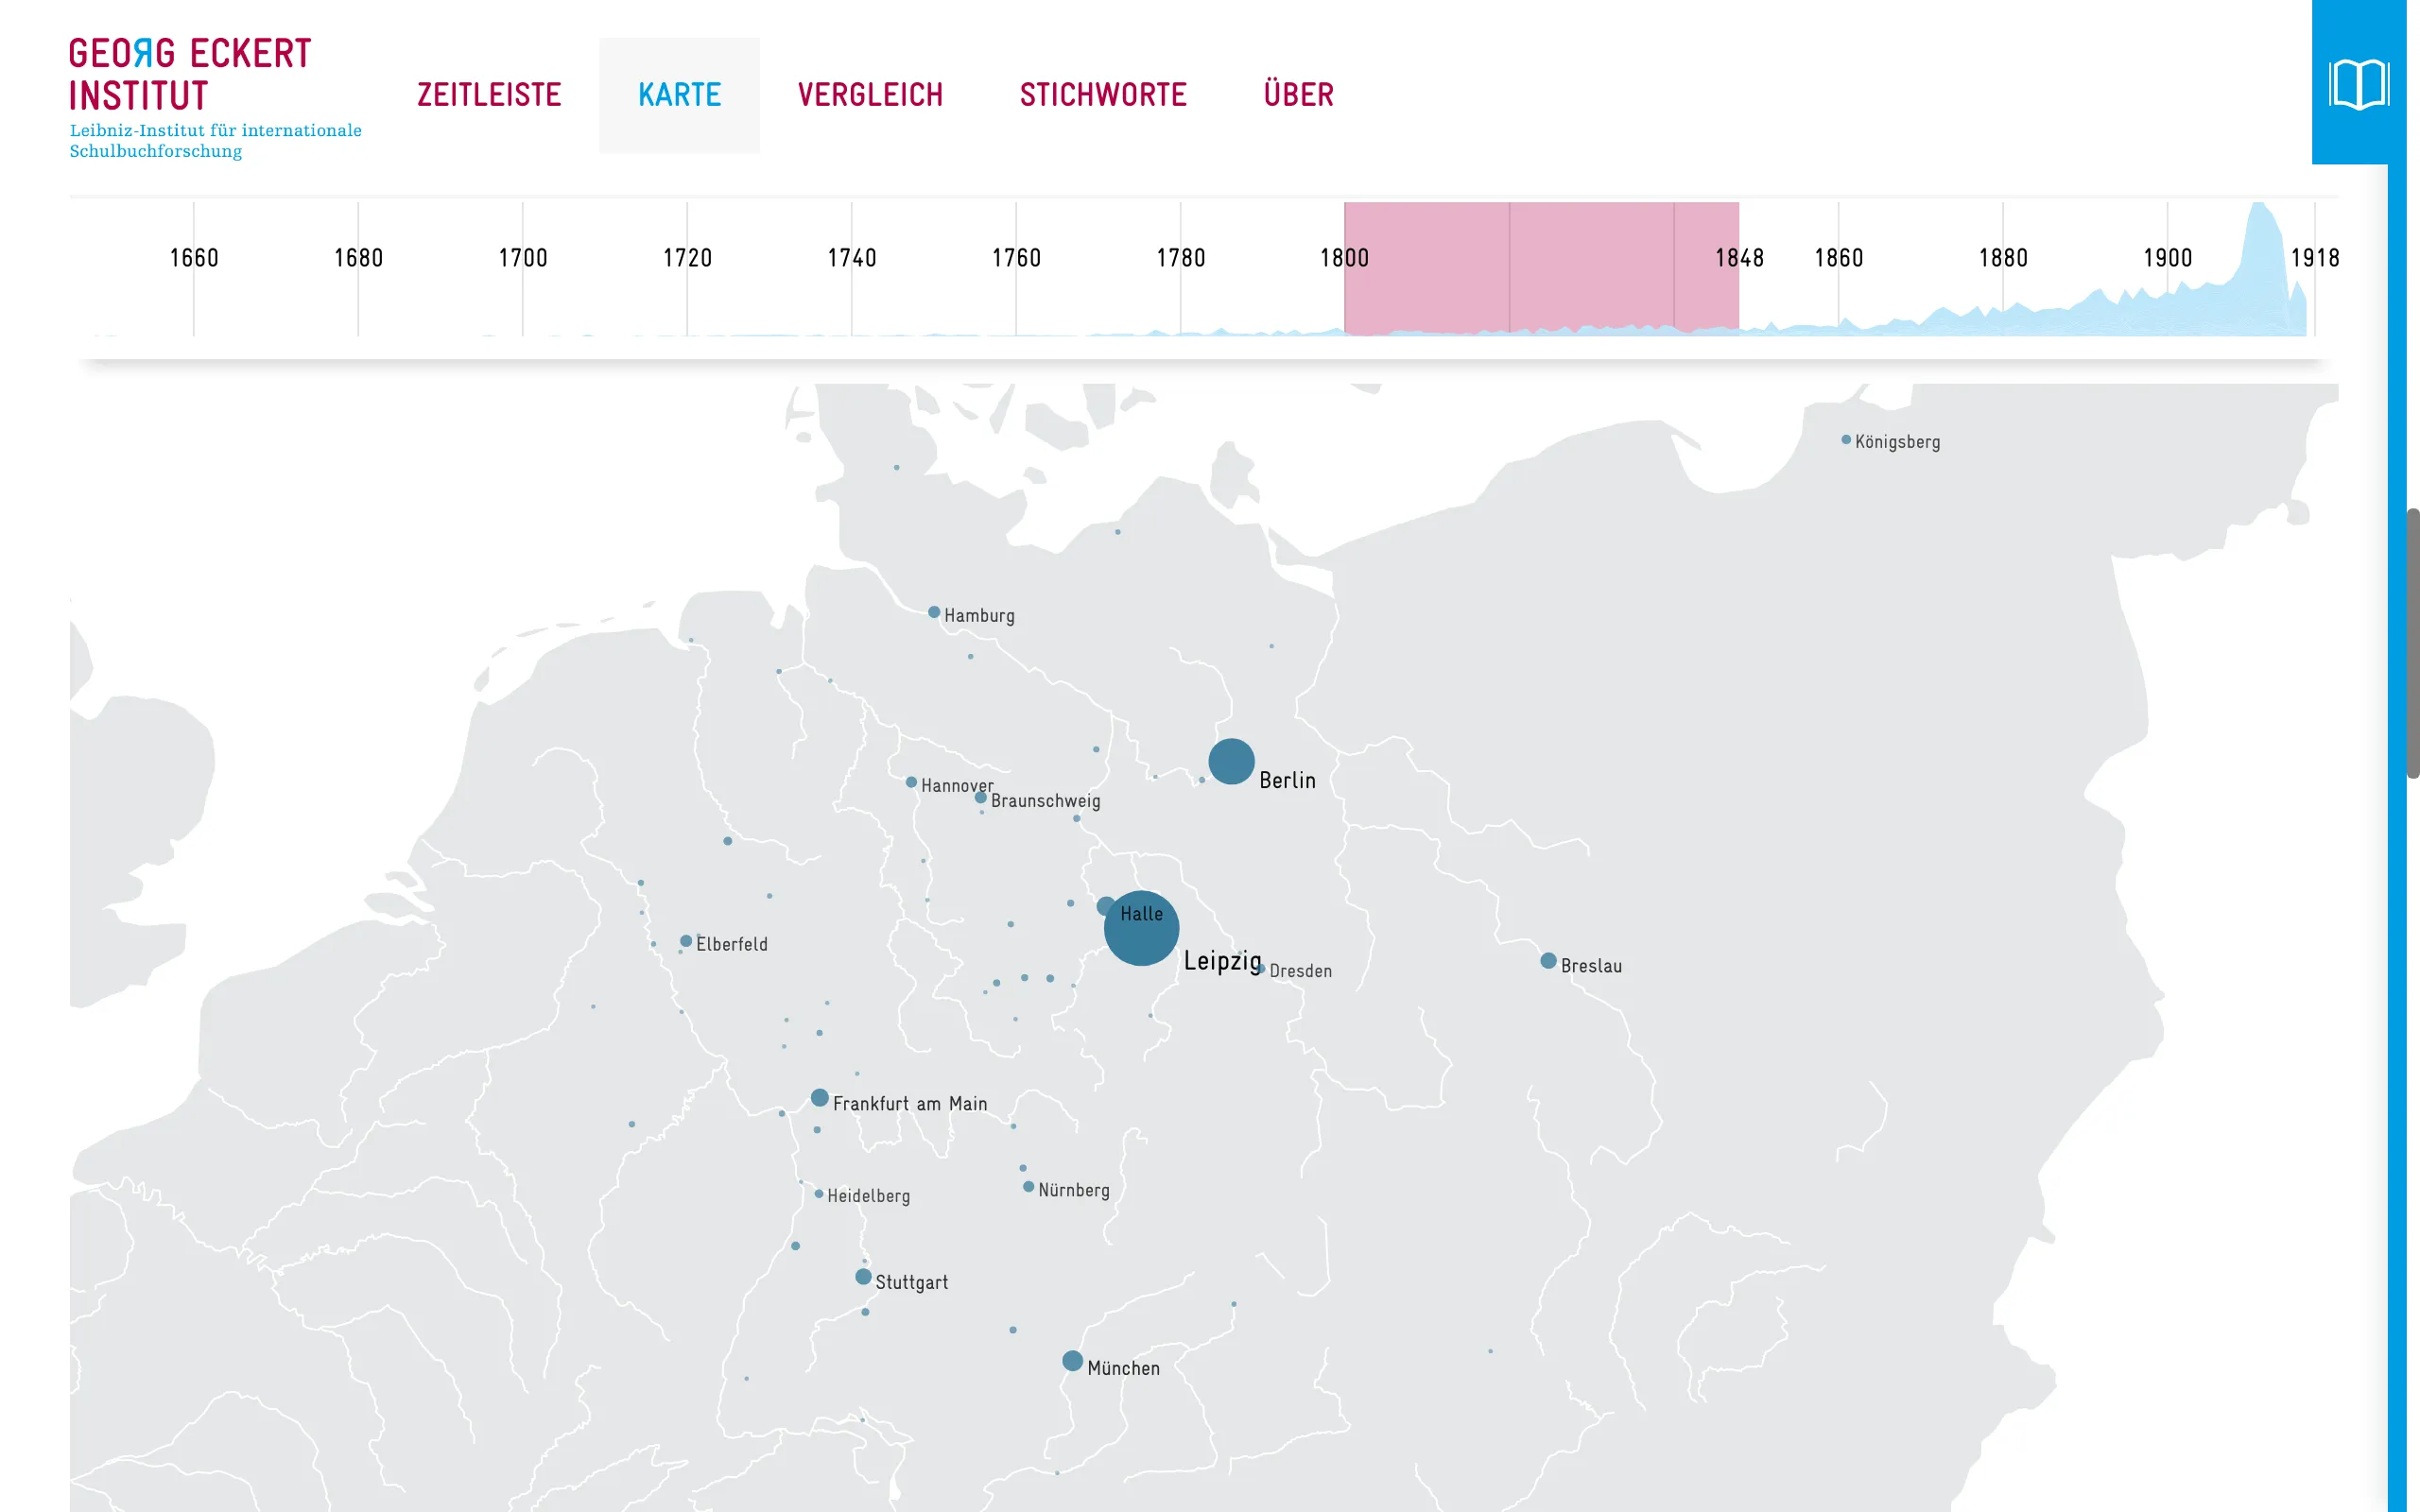
The timeline shows how the books spread over time, broken down by school subject, school level, publisher or place of publication. A time span selected by dragging across it carries over to the other three views, where the timeline shrinks into a small widget at the top of the screen. The map places the books at their places of publication. It leaves out national borders, which changed too often over this period, and uses rivers and the North Sea and Baltic coastlines for orientation instead.
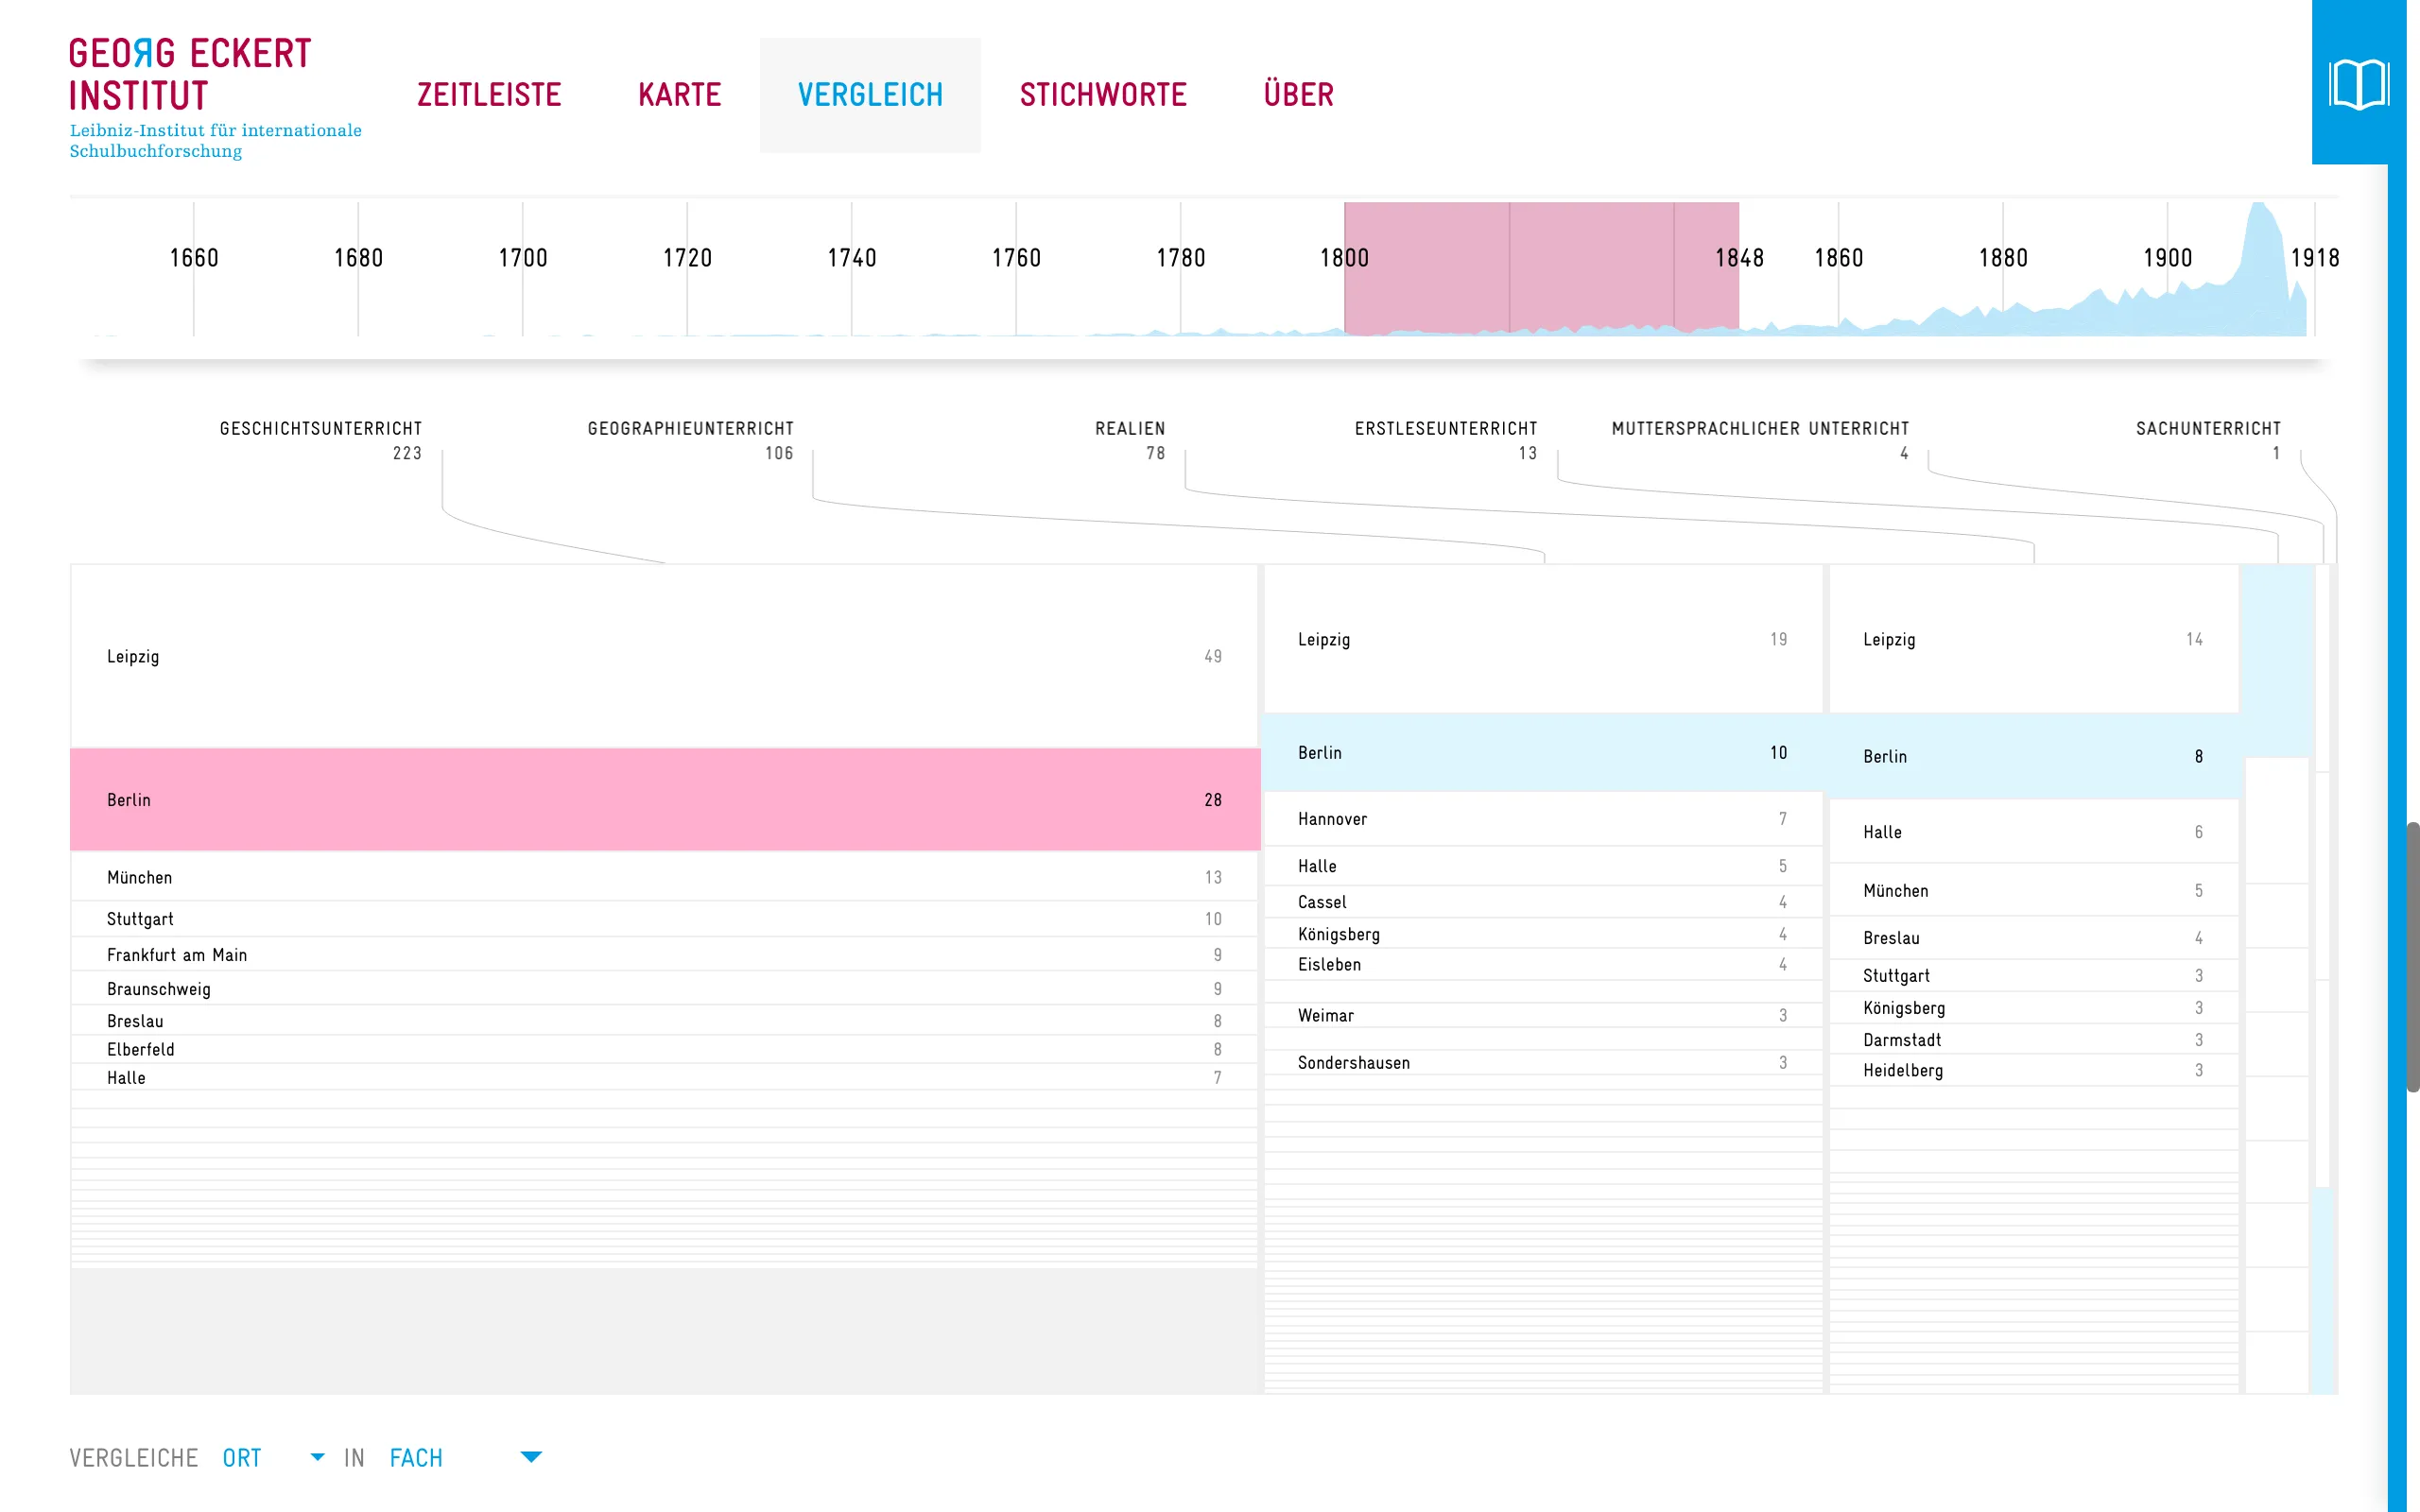
A comparison view sets facets against each other in a table, for example places against subjects.
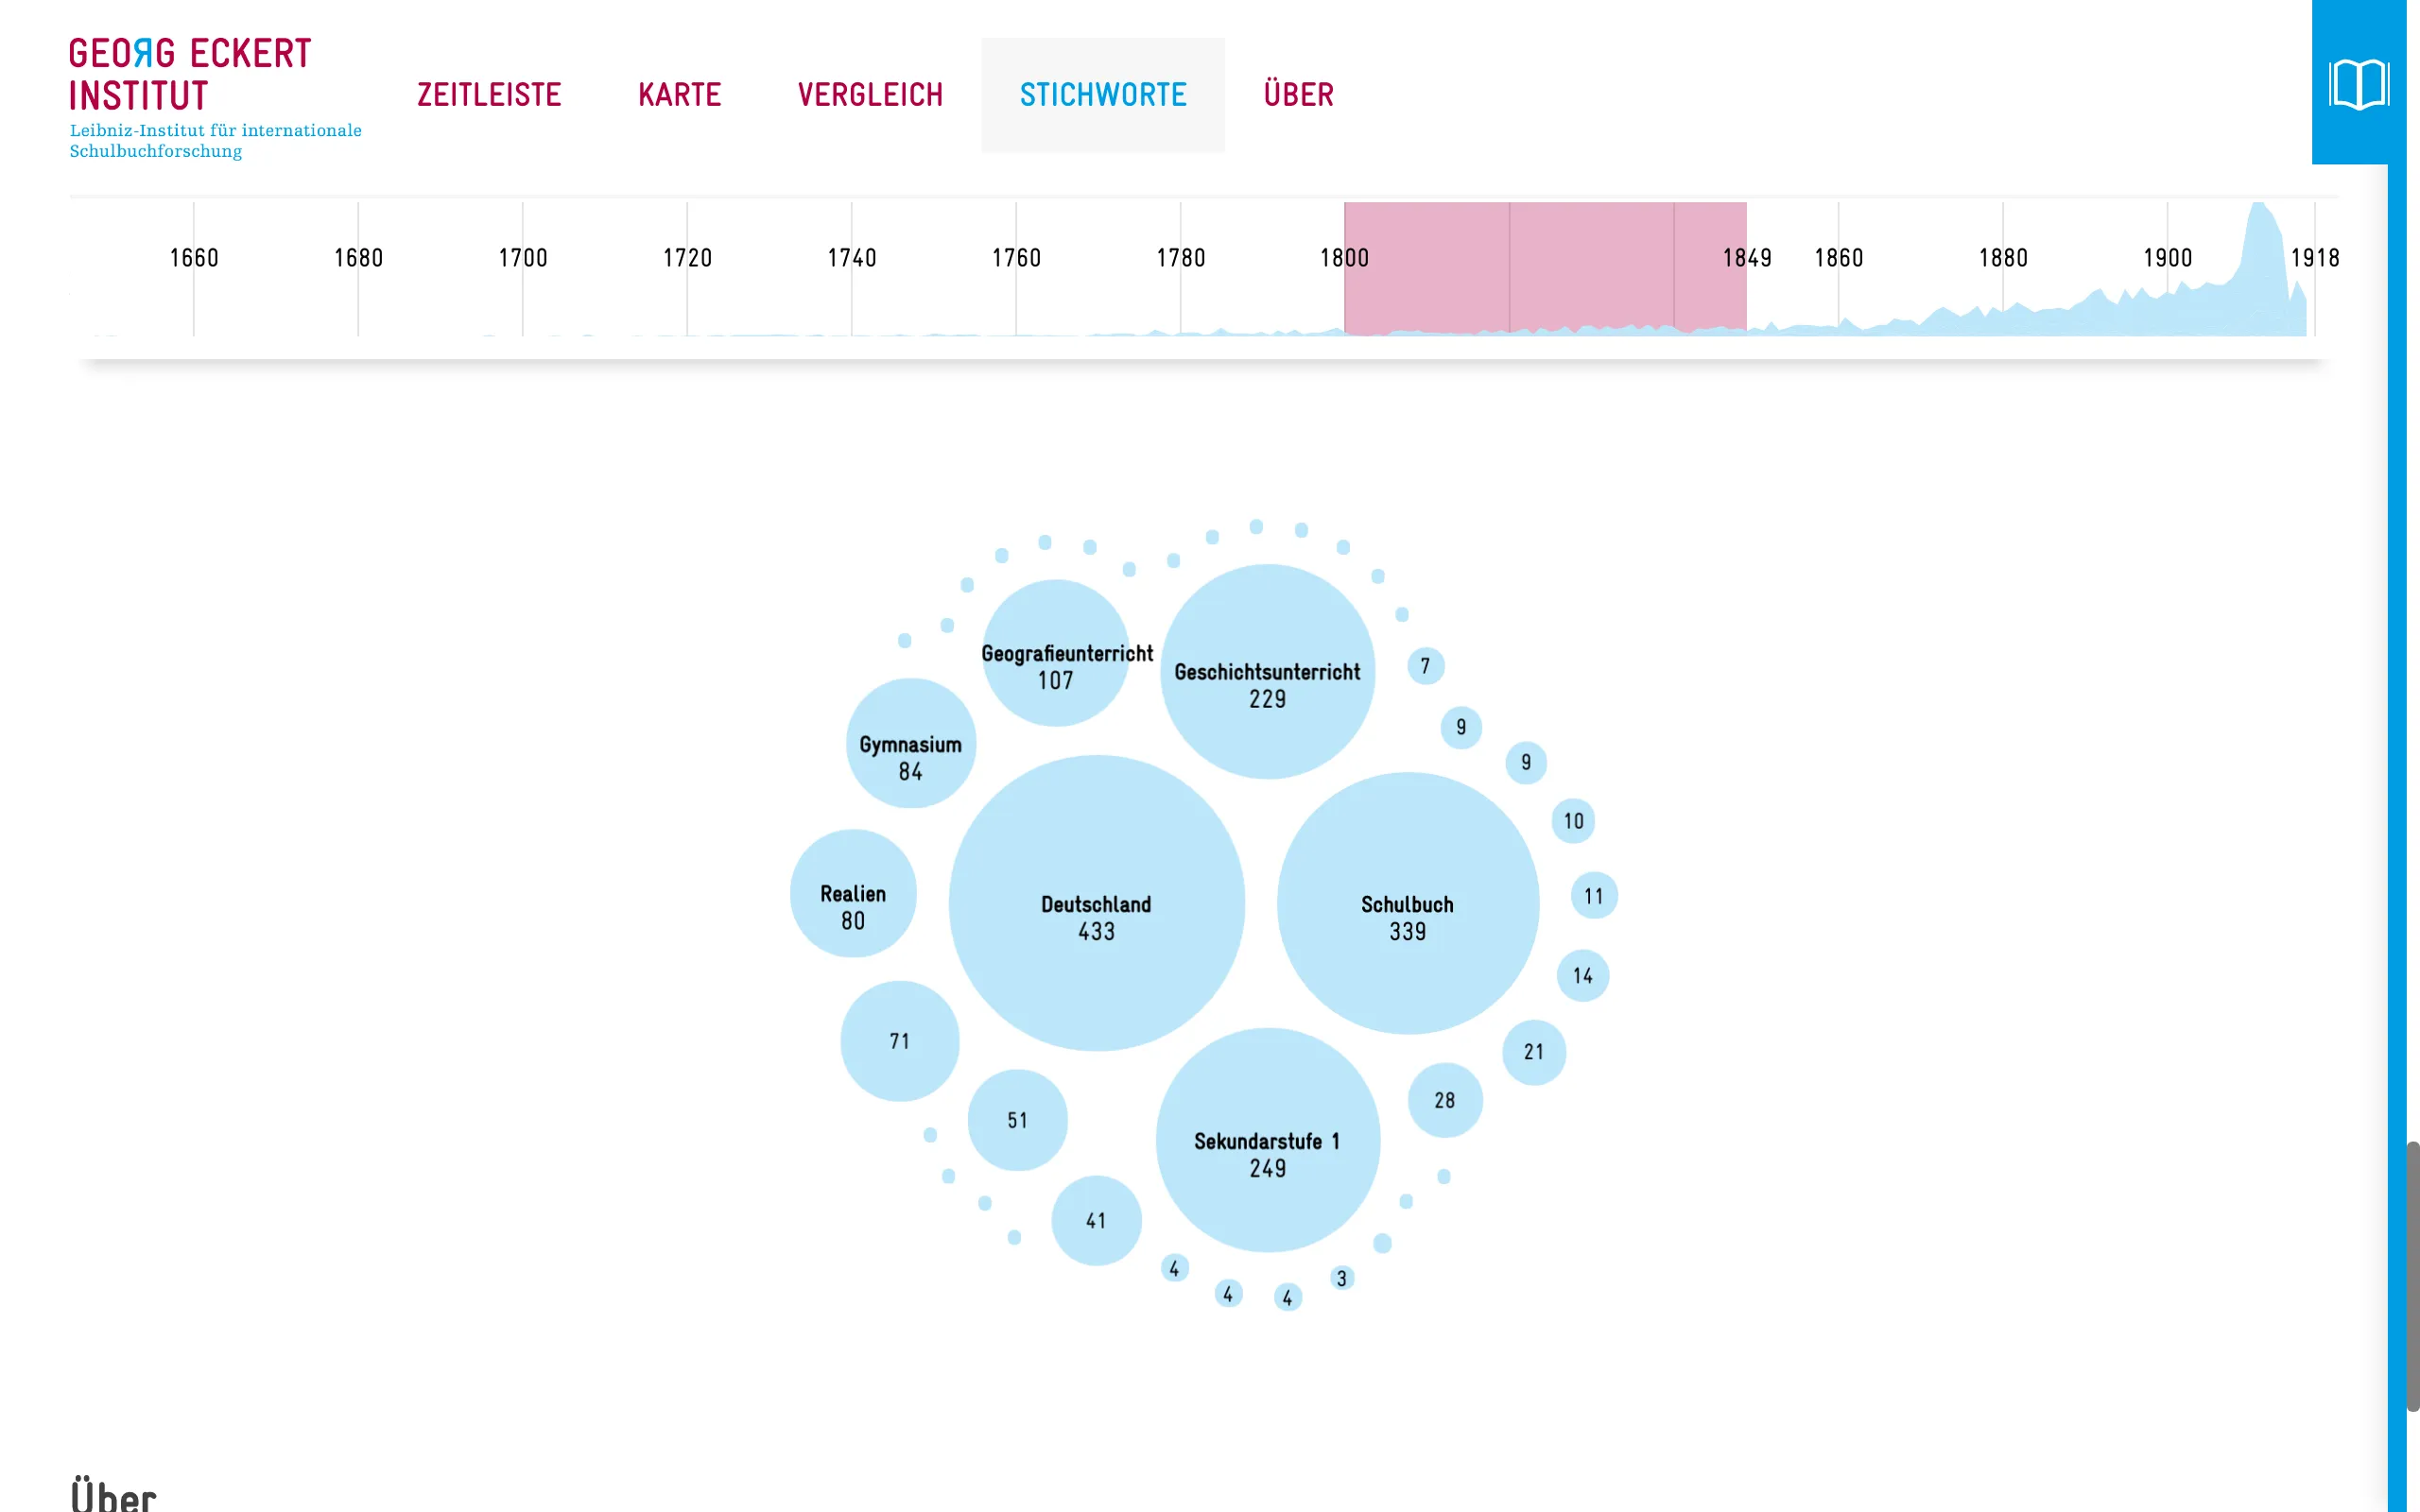
A tags view shows the most frequent keywords and which of them occur together across the collection. Whatever is selected, the matching books appear in a drawer at the right edge, each linked to its digitized volume in GEI-Digital.
My parts were the timeline, a stream graph that is integrated with the other views and collapses into the widget at the top, and the map. Gabriel Credico and I designed and developed the site at the Urban Complexity Lab of FH Potsdam. It came out of a research project with the institute’s historians and data scientists, under the scientific direction of Marian Dörk. The views draw on GEI-Digital’s metadata as of February 2017. The GEI presented the tool at the Deutscher Bibliothekartag that spring, and GEI-Digital still lists it among its applications.