DataSkop
A desktop app in which people explore their own YouTube or TikTok data before deciding whether to donate it to research on the platforms' recommendation algorithms.
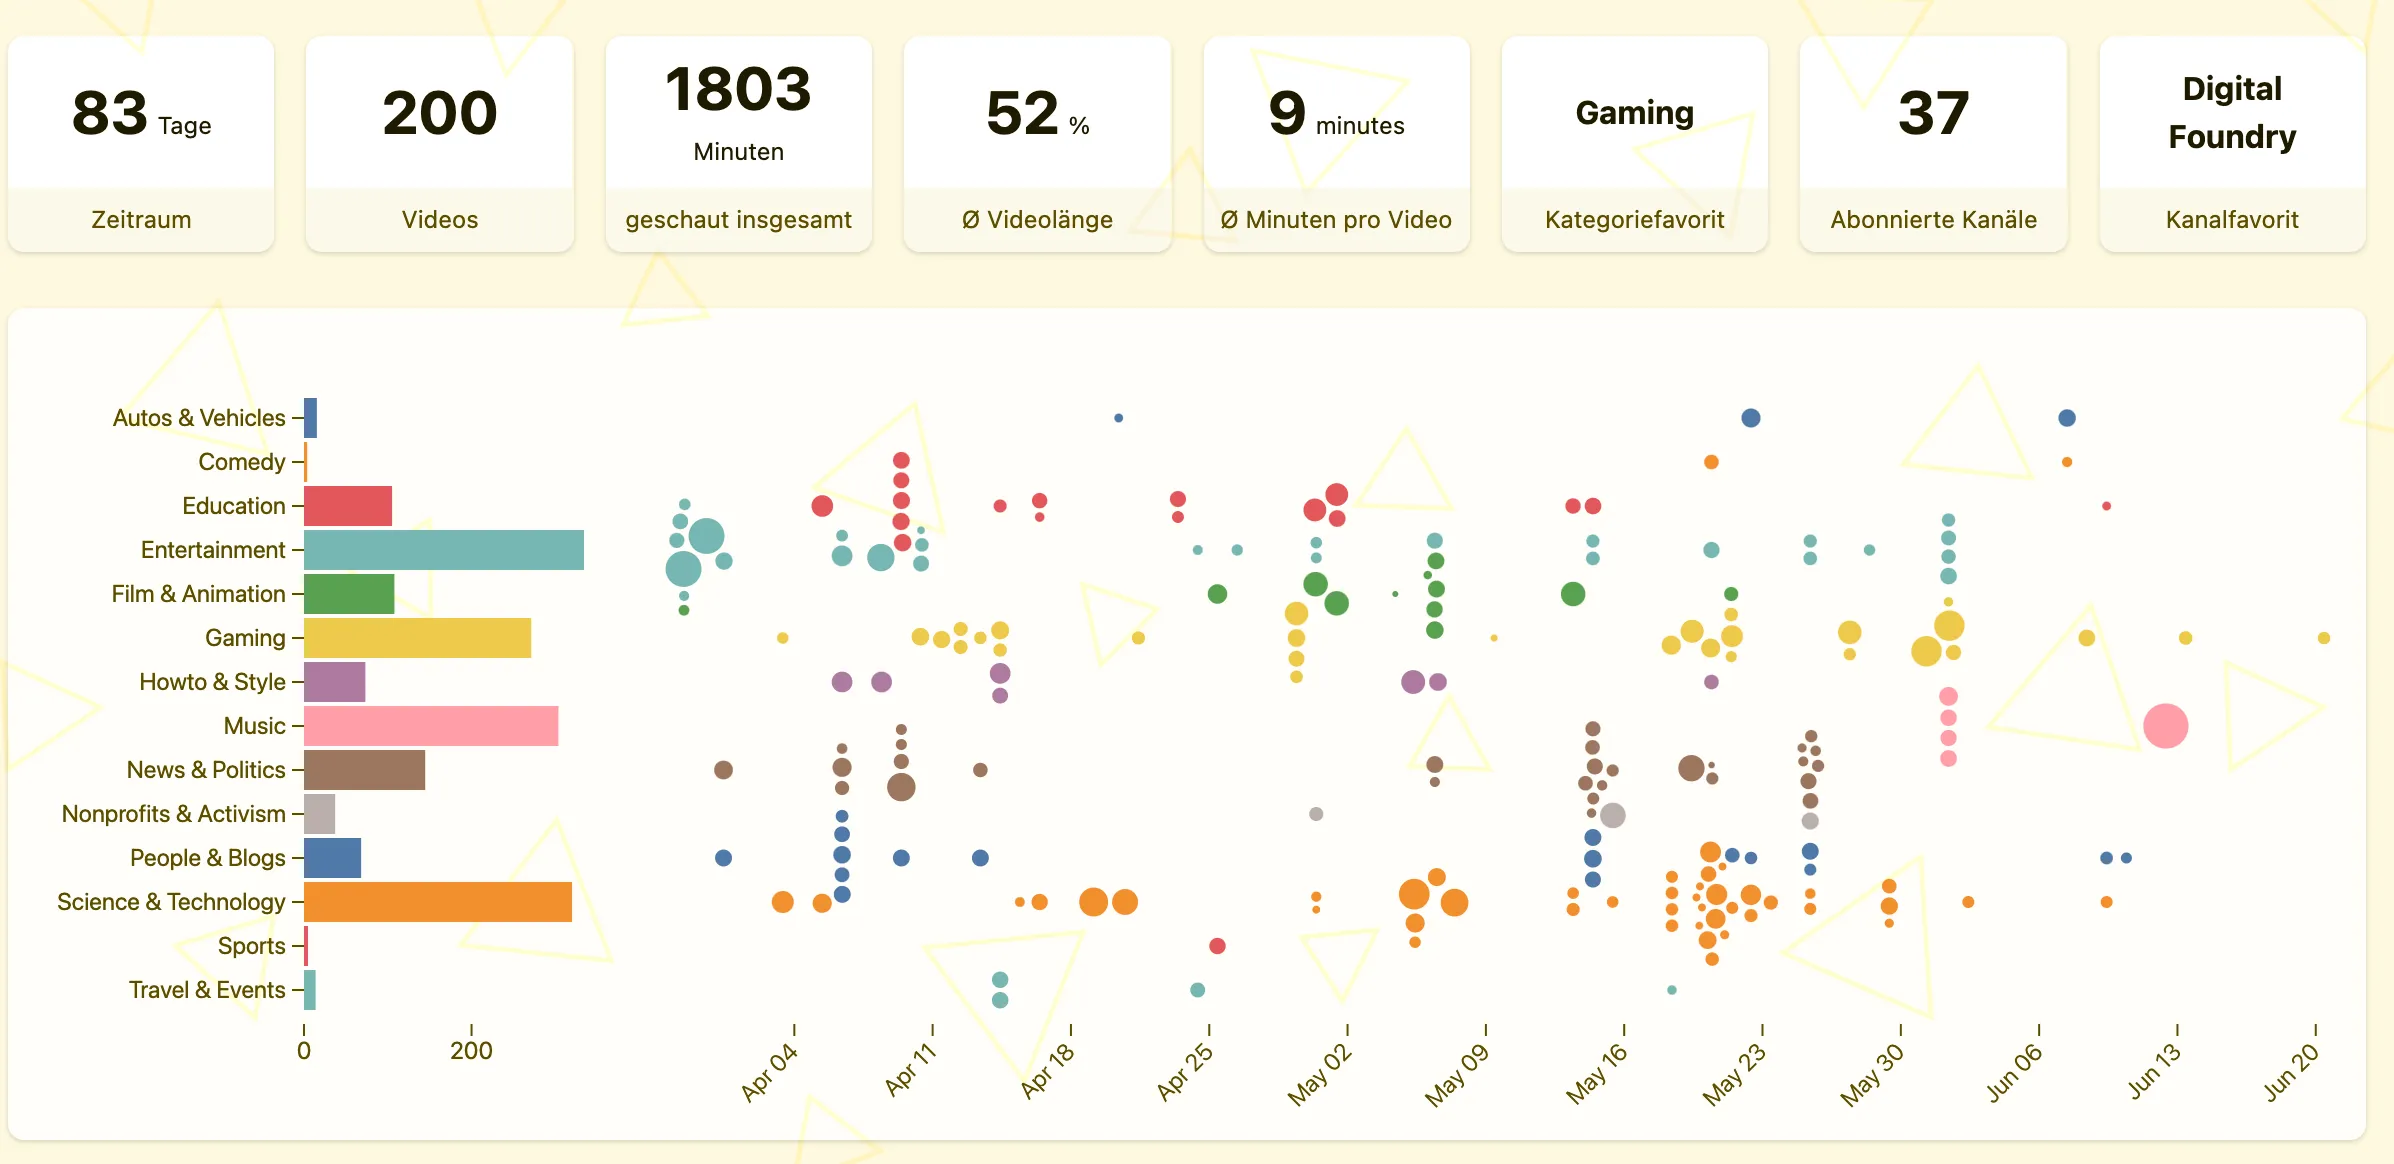
Before anyone donates their data, DataSkop shows it to them. Most studies of YouTube’s recommendations had observed the platform from the outside, without a logged-in account; DataSkop instead asks people for data from their own accounts. The desktop app first lays out their profile in interactive visualizations, where they can look for patterns and anomalies, and only if these experiments convince them do they donate the data to research.
The pilot, »Wahlempfehlung: Was zeigt dir der YouTube-Algorithmus zur Bundestagswahl?«, collected donations for six weeks, from July 15 to August 25, 2021, on the recommendations and search results YouTube delivered around the German federal election. Researchers at European University Viadrina analyzed them together with data journalists from Der Spiegel and Stiftung Neue Verantwortung. A second campaign, on TikTok’s recommendation algorithm, followed in January 2023. The app runs on Windows, macOS and Linux; donations go to the project’s own platform, where donors can download or delete what they gave.
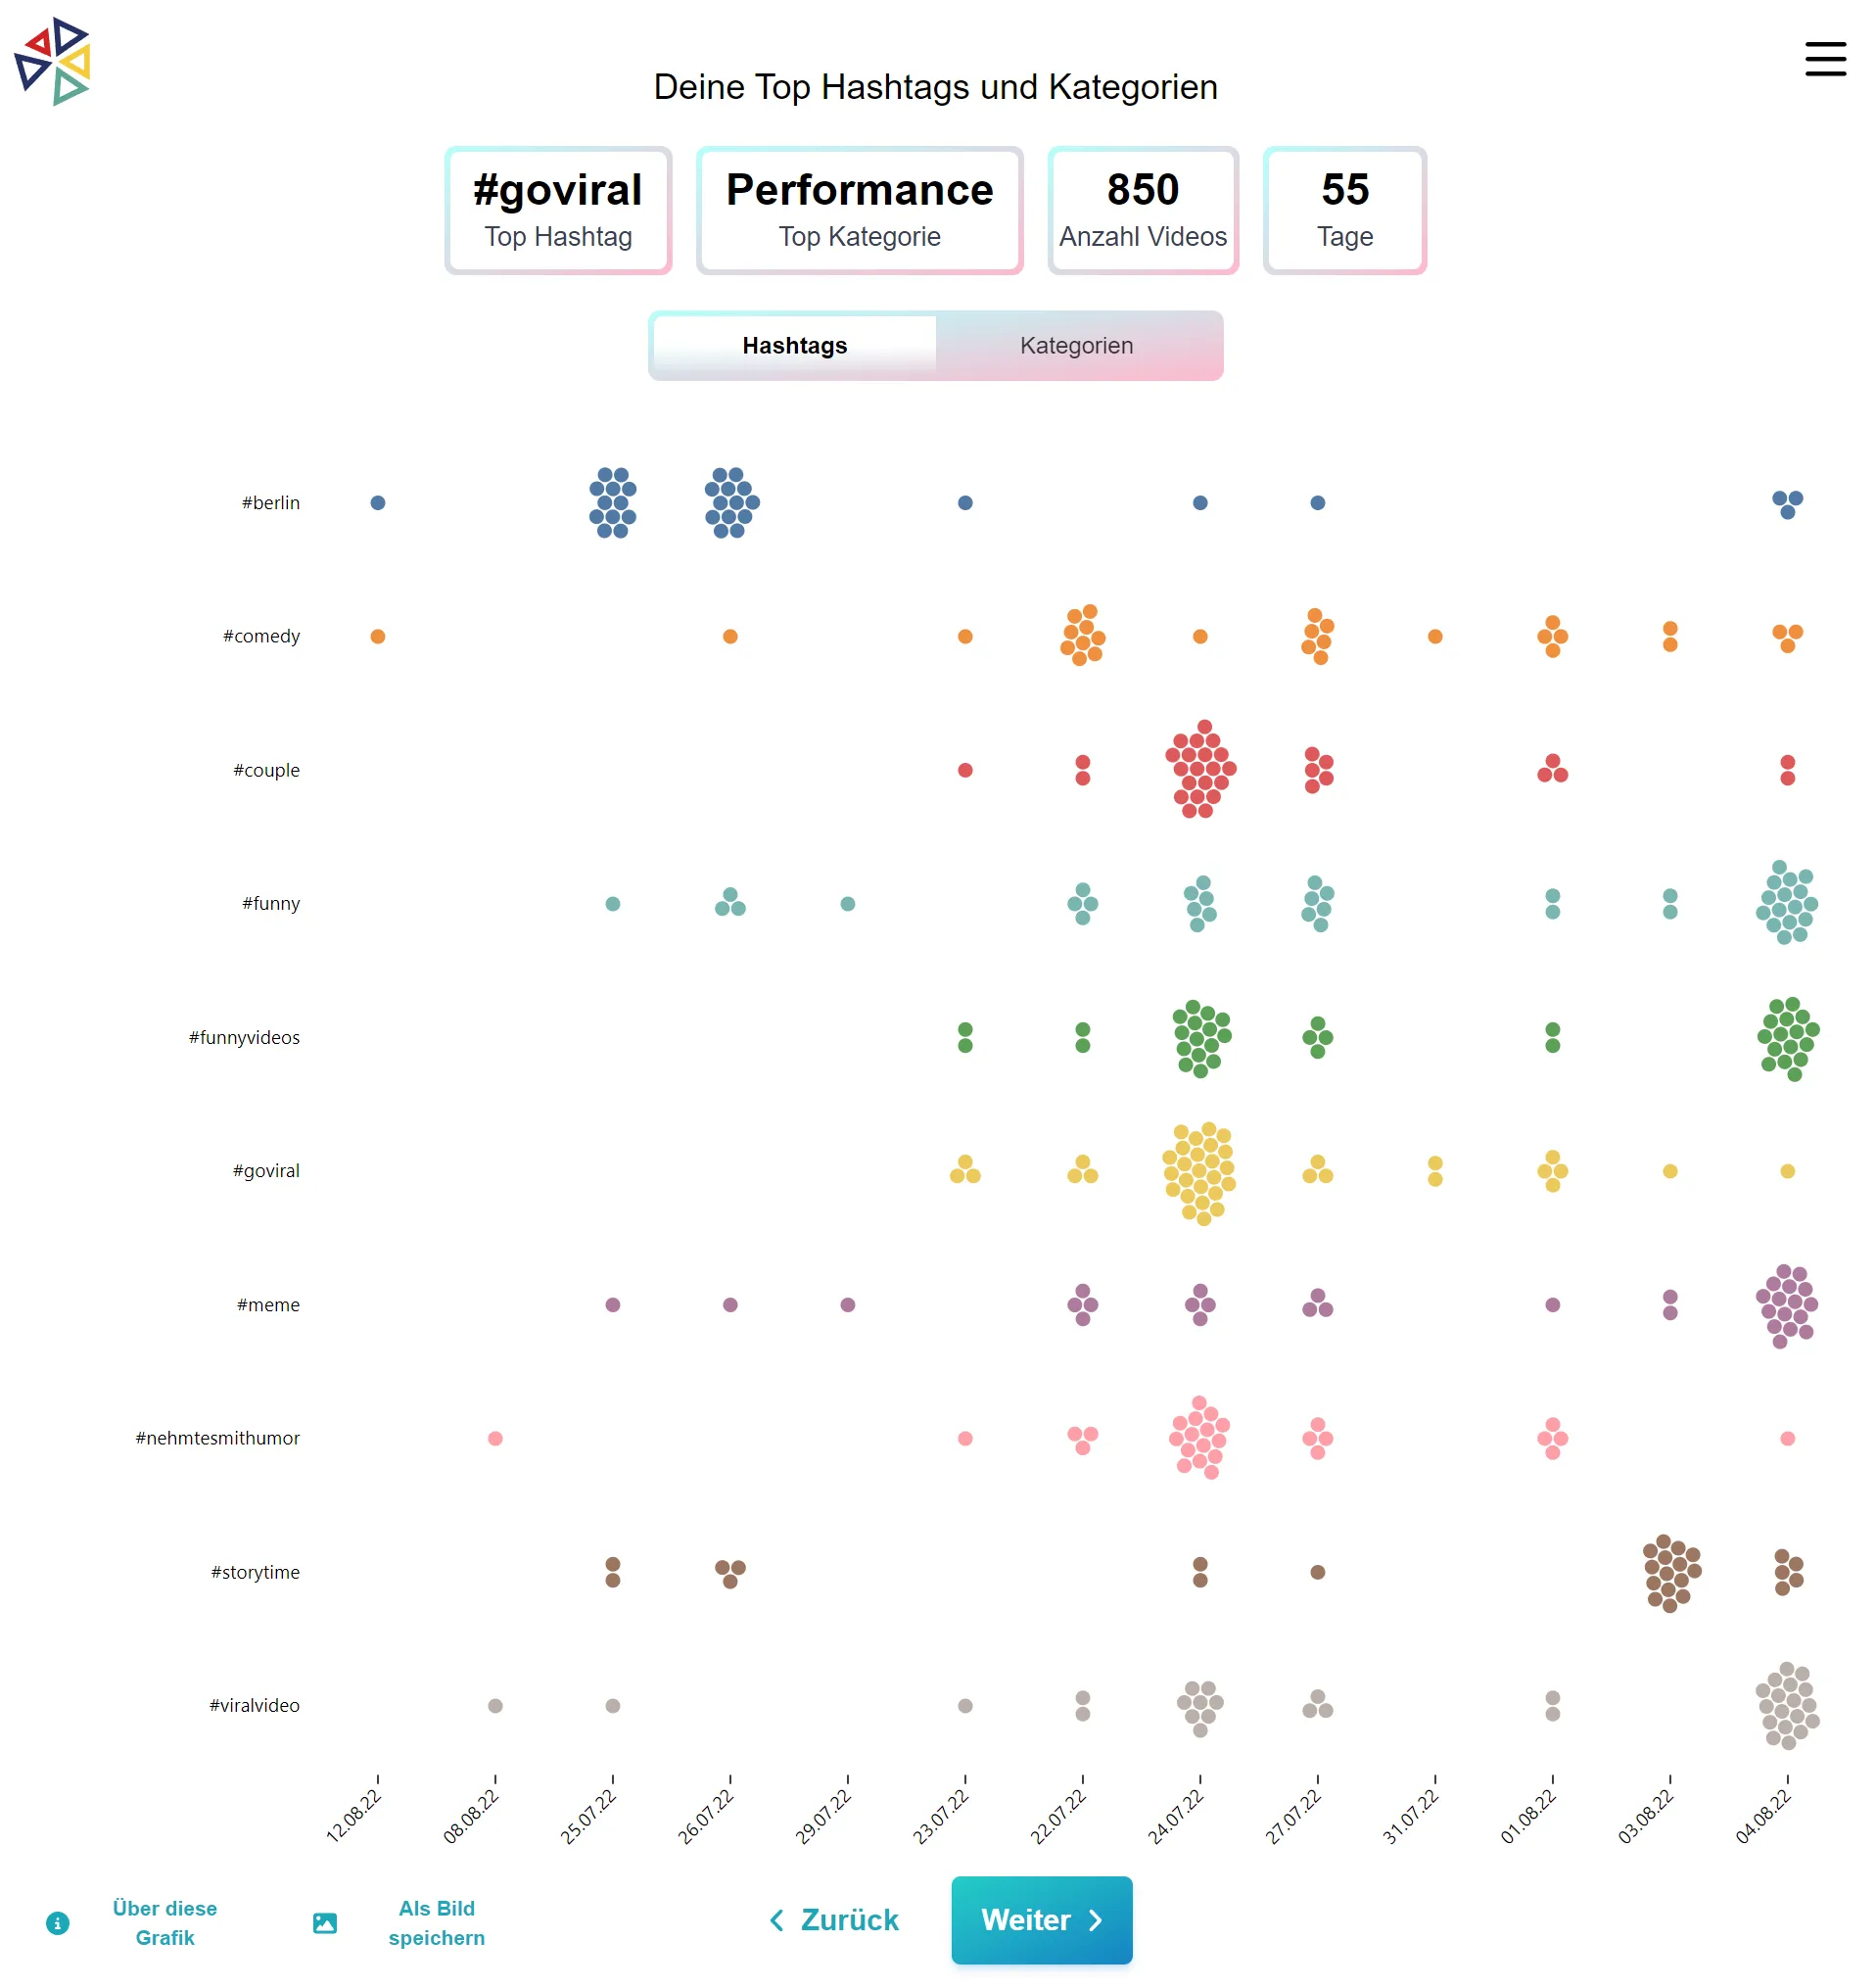
DataSkop is a three-year joint research project coordinated by AlgorithmWatch with European University Viadrina, FH Potsdam’s Design Department (which developed the visualization concepts), Paderborn University and Mediale Pfade, funded by Germany’s Federal Ministry of Education and Research. I worked on it as external support, credited for visualizations and software development. In the app’s open-source code, my commits start the YouTube pilot’s profile dashboard and the view of each user’s collected data (July 2021), and the first versions of two beeswarm visualizations for the TikTok campaign (November–December 2022). One of them counts the videos a donor watched for more than five seconds, one dot per video, grouped in rows by the hashtags their creators gave them or, at the flip of a switch, by TikTok’s own categories.